An African perspective. A global outlook.Independent learning · Informed decisions
BridgePointFINANCE
Ticker tape by TradingView
RWANDA + EAE20
CLOSING SNAPSHOT
RSE source: 28 Sep 2026, 14:31 CAT · Fixed snapshot, not liveGlobal quotes: provider delays apply
Business Finance Toolkit · Workshops · Business reviews — Explore offers and pricing
BRIDGEPOINT FINANCE / GLOBAL

Your financial world, connected.

Knowledge for every stage of your journey
THE BIG PICTURE

Small habits. Long-term growth.

Make sense of your money. Explore markets, build your knowledge and plan your next step.

THE POWER OF COMPOUNDING100,000 → 215,892Illustration: 8% yearly for 10 years. Before fees and taxes; not a forecast.

Markets at a glance

Explore markets

Build your financial confidence

All guides

Read markets with context

Explore markets

Market data can be delayed. Confirm prices and terms directly with the provider.

Global companies at a glance

TRADINGVIEW / WORLD STOCKS

Selected names from TradingView. Open the source for current rankings and prices.
A REAL DATA STORY

When commodity prices move, everything else does too.

A quiet look at the World Bank Pink Sheet commodity indices, 1960–2024. Play the canvas to watch the long arc; the source is carried on every frame.

Source: World Bank Commodity Price Data (The Pink Sheet) · CC BY 4.0
World Bank Commodity Price Data · CC BY 4.0 · annual index, 2010 = 100 · Source: World Bank Pink Sheet

2024

Loading sourced sample…

12 × 9 · Word / PowerPoint / Excel

Consulting toolkits

Practical working documents for the decisions your business is making now.

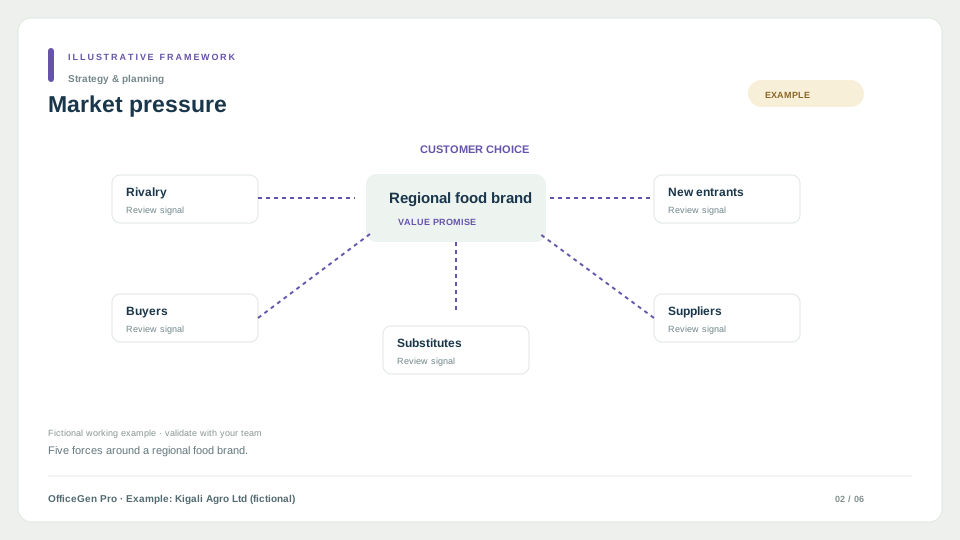
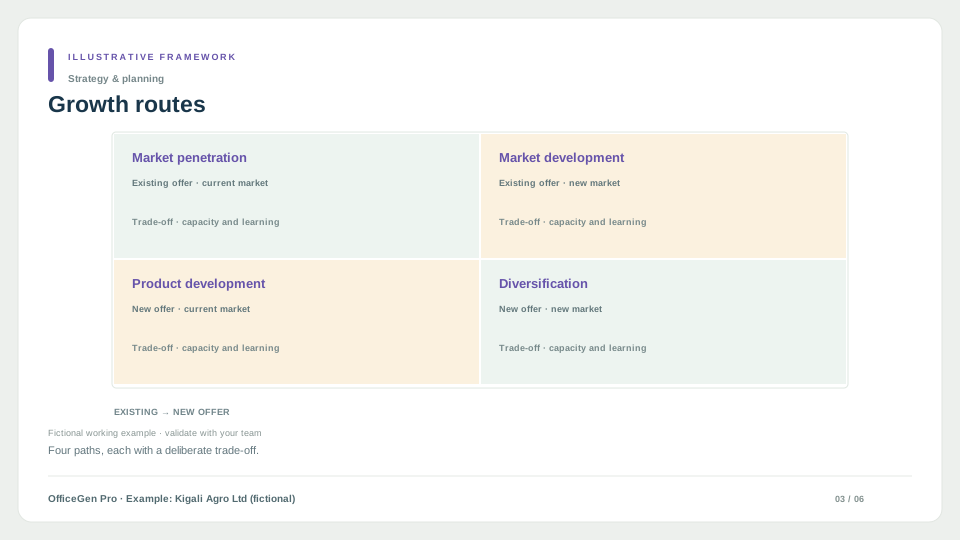
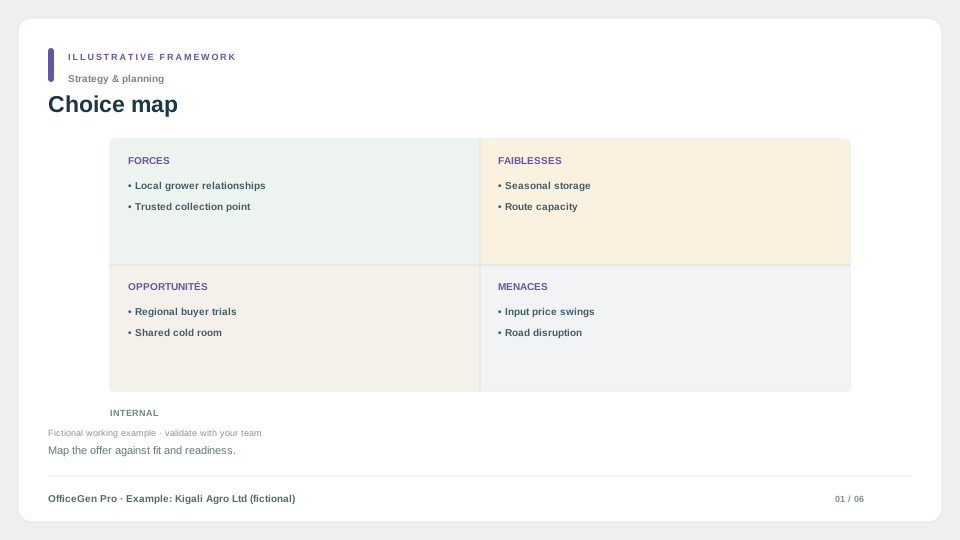
Choice map slide, fictional exampleMarket pressure slide, fictional exampleGrowth routes slide, fictional example

Illustrative previews with fictional data. Your toolkit is generated for your business.

Browse the collection